Runs in your environment
Deployed as containerised, infrastructure-as-code components inside your own cloud. You run, restart and monitor it. Nothing depends on our infrastructure staying up.

Atlas — systems for physical infrastructure
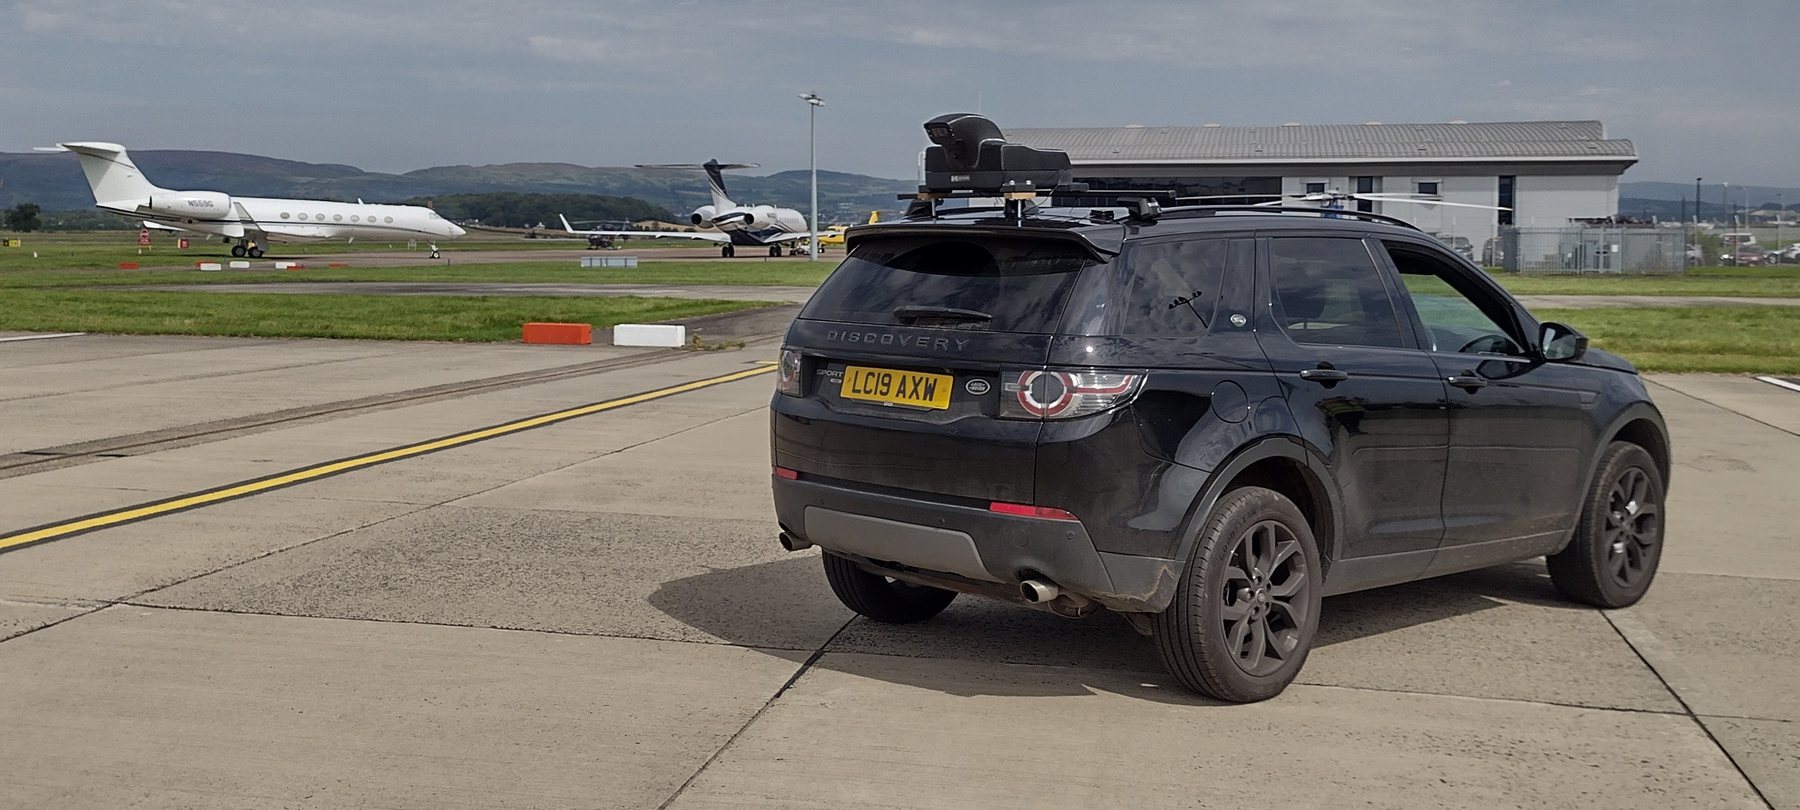
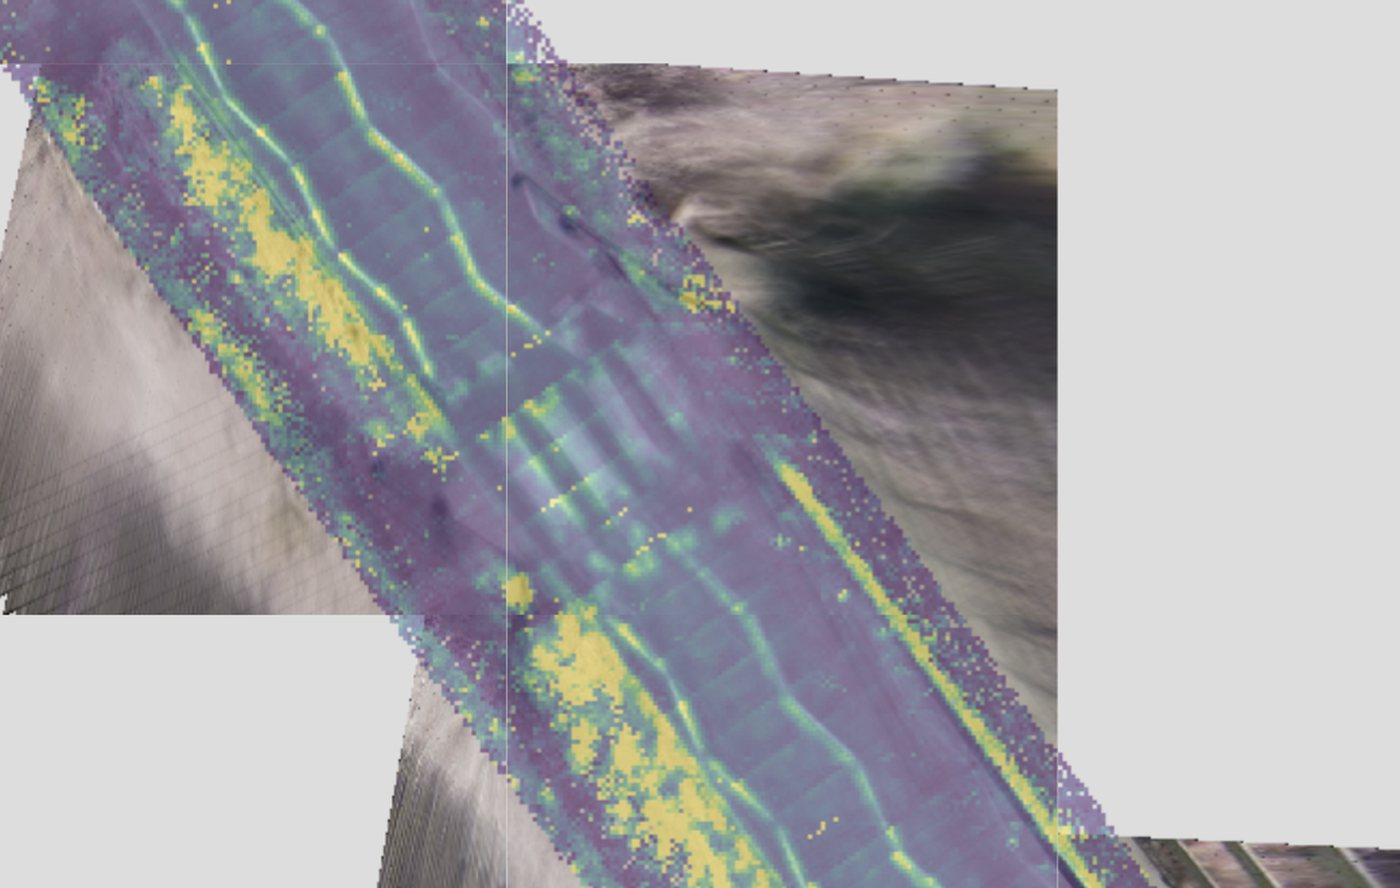
Repeat sensor data goes in — LiDAR, imagery, and whatever else you already capture. A ranked, evidenced list of the fixes your teams should act on comes out, published straight into the asset management system you already run. No new platform to adopt. No new interface to learn.
02 The problem
Sensor costs collapsed. Survey frequency went up. The volume of data captured on every network now grows faster than any team of engineers can look at it.
What arrives is fragmented, too. Aerial LiDAR from one vendor every few years. Drone photogrammetry per project. Vehicle passes annually. Manual inspections every six months — different vendor, different format, different cadence. Someone re-keys it into a report or spreadsheet, project by project, with no shared memory.
The constraint stopped being capture. It became memory.
What arrives — different vendor, format & cadence
Today
Re-keyed by hand. One project, one analyst. No memory — every cycle starts from zero.
With Atlas
One spatio-temporal record per asset. Confidence-scored. Decision history retained.
03 Where Atlas sits
Sensing already has a growing set of standards — LiDAR and imagery from your existing fleet, or from a capture partner. Acting already has one too — your crews, your contractors, and in time your robots, dispatched through the asset management system you already run.
What sits between the two has no standard at all: turning a raw point cloud or image set into a classified, measured, prioritised list a person can act on. That is the layer Atlas builds.
Any sensor in. Classified objects out.
Sense
Your fleet, or a capture partner. LiDAR, imagery, GPR, thermal.
Interpret & decide — Atlas
Classify, register, detect change, score and link to the asset.
Act
Your engineers, your crews — and eventually, your robots.
04 Why trust the score
Most "AI" output today is generated: plausible, fluent, and occasionally wrong in ways that are hard to catch. An infrastructure decision can't work that way.
Atlas doesn't generate an answer. It measures one. A slope that moved 12cm is measured, not implied. Every score is boundable, and every finding can be independently re-surveyed and re-measured — so trust in it doesn't have to be taken on faith.
A chatbot can be plausible and wrong. An asset inspection can't.
| Generic AI | Atlas | |
|---|---|---|
| Ground truth | Emergent from language — ambiguous | Geometric & measurable — a slope moved 12cm |
| Method | Generative — predicts the next token | Discriminative — measures, then classifies |
| Failure mode | A fluent, confident, wrong answer | A missed defect or false alarm — both boundable |
| Verification | Read it and judge — subjective | Re-survey and re-measure — objective |
05 How it works
Any sensor in. Classified objects out.
Processing is automated and triggered on upload — no operator sitting in a GUI. Every stage produces a named artefact in an open format, so you can audit, re-run or hand any step to another supplier.
Any sensor's output — LiDAR, imagery, GPR, thermal — is parsed and spatially indexed. Equivalent tiles matched across survey epochs automatically.
ASPRS-standard classification, extended with the classes your asset base actually needs.
Systematic offsets removed, ICP refinement applied. Residual alignment error reported per tile as a QA metric.
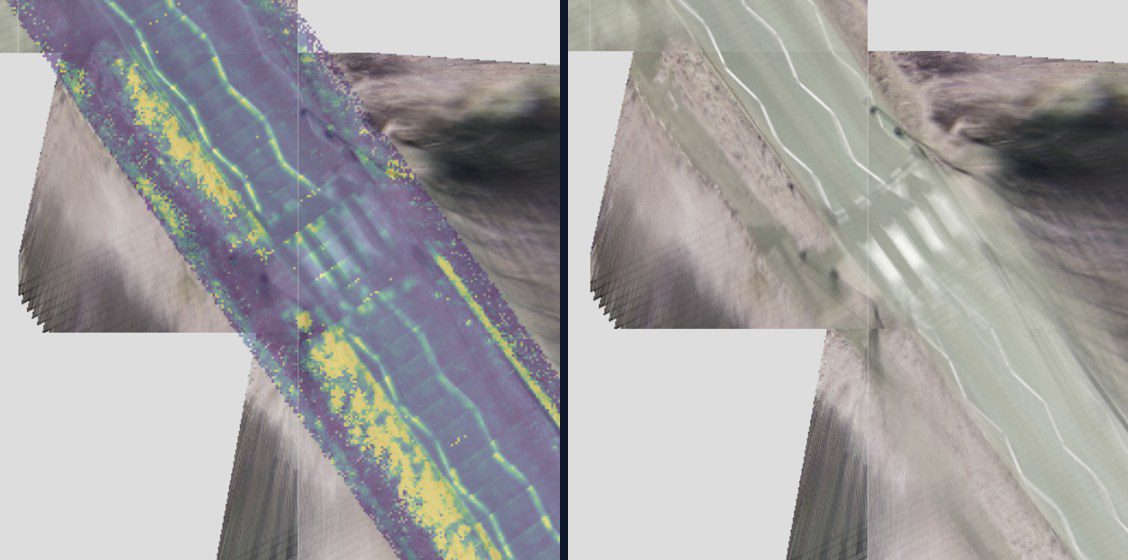
Quantitative cloud-to-cloud comparison using M3C2, with per-point change distance and level of detection.
Severity and confidence combined into one recommendation, linked to the asset it belongs to.
Delivered into your asset management system by API, in open formats you keep.
06 Oversight
Safety-critical assets do not get a black box on day one. Atlas starts by assisting your engineers and only takes on more once its record justifies it — measured on your data, against your acceptance criteria.
Each step is a per-class switch, not a system-wide setting. It can be revoked the moment error rate creeps up.
As robotic maintenance becomes real — inspection crawlers and drones today, repair robots tomorrow — this is the ladder that extends. The oversight model doesn't change; only what's on the other end of the work order does.
Every candidate surfaced and ranked. Your engineer reviews all of them.
Atlas proposes the action with its rationale. Your engineer approves or overrides.
Narrow, proven classes dispatch directly. Engineer notified, not gating.

07 Integration & assurance
One spatio-temporal record per asset — confidence-scored, with full decision history — synced into the asset management or digital twin platform you already run: Maximo, SAP EAM, ArcGIS, or your own.
Deployed as containerised, infrastructure-as-code components inside your own cloud. You run, restart and monitor it. Nothing depends on our infrastructure staying up.
LAS 1.4 / LAZ and COPC for point clouds. Cloud-Optimized GeoTIFF for rasters. GeoPackage and GeoJSON for features. STAC for cataloguing. Nothing proprietary on the way out.
Findings are published into the asset management or digital twin platform you already run — Maximo, SAP EAM, ArcGIS, your own — by API. We are not asking anyone to change how they work.
Every output carries a manifest: source tiles, epoch dates, pipeline version and model version. Reproducible without access to our internals.
Fig. 4 — Your ability to use, archive or re-process the outputs never depends on us.
08 Where it runs
Ingestion, registration and change detection are the same wherever they run. What changes per sector is thin: the classes we look for, the risk taxonomy, and where findings get published. That is why a second asset class takes a fraction of the effort the first one did.
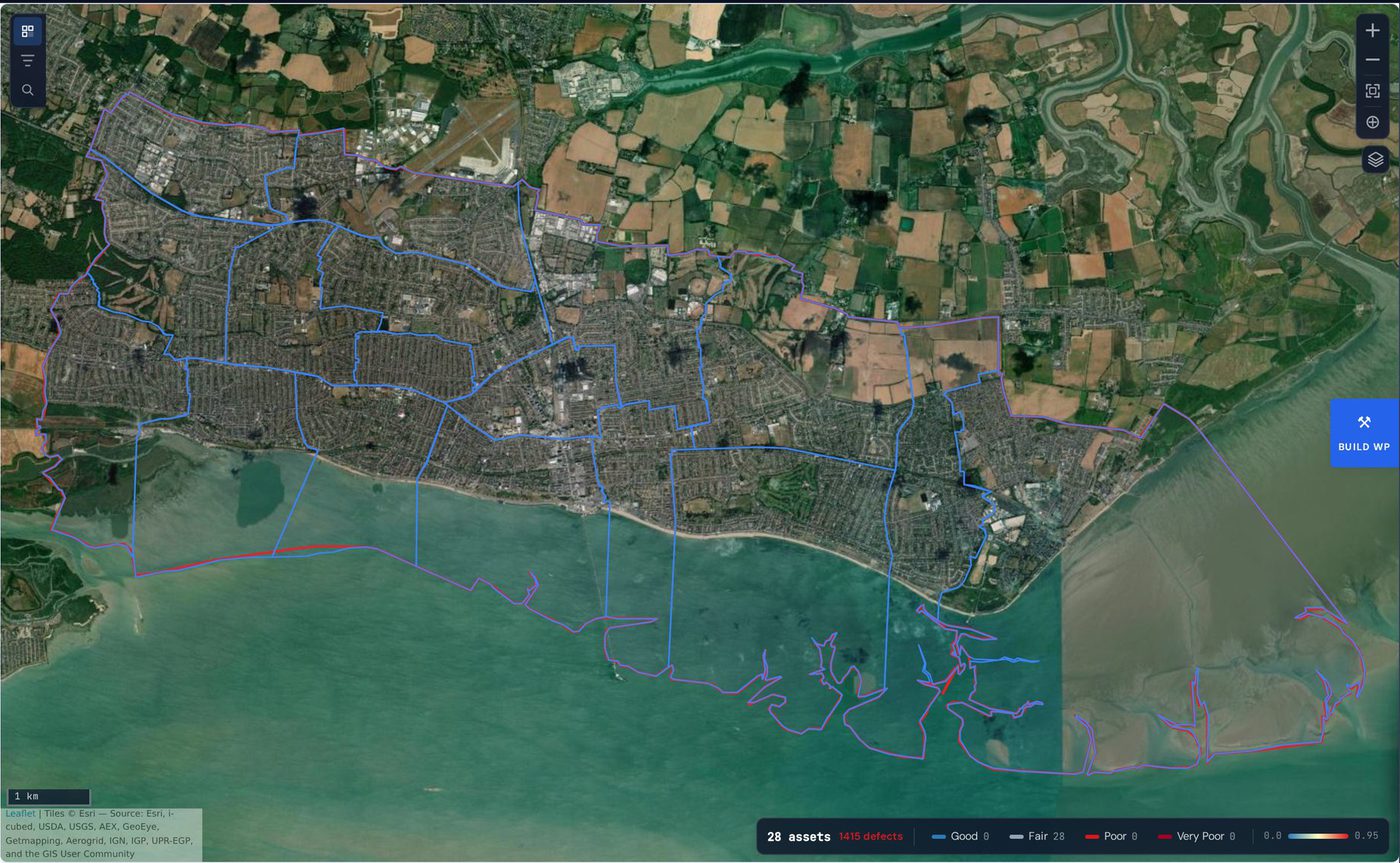
Pavement condition and defect detection across operational road and airfield networks.
Cutting and embankment change detection at national survey scale.
Substation crawlers, transmission corridors, solar and wind assets.
Facades, HVAC systems and structural surveys across buildings and estates.
Tanks, flare stacks, pipeline welds and subsea structures.
Fig. 5 — Sectors shown by current maturity, not ambition.
09 How to start
A defined asset population and epoch pair. Fixed price, phase-gated, with acceptance criteria agreed up front.
Your engineers assess the findings against ground truth. Technical evidence pack and knowledge transfer at each phase end.
Extend to the wider network under a framework or subscription, with the loop feeding model improvement.
10 Contact
The most useful first conversation is a specific one: which assets, which surveys you already hold, and what decision you are trying to make with them.
Prefer email? john.hill@atlas-geoinformatics.com